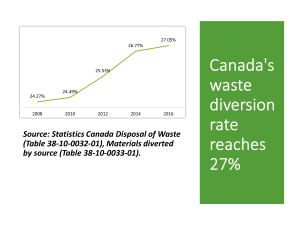
A diversion rate of 27% might not sound too impressive but it’s better than the 24% of a few years back. According to the latest Statistics Canada data, we dumped almost a million tonnes less in 2016 than we did in 2008 while at the same time diverting almost a million tonnes more from landfill.

Both industry and residents were responsible for this result, diverting waste in roughly equal proportions (48% and 52% respectively). But there are some key caveats to interpreting this information.
For starters, while the waste categories measured are very broad (paper, plastic, glass, metals, textiles, organics, electronics, white goods, and construction, renovation and demolition waste), certain streams that are more likely to be industrial in nature were excluded from the calculations (materials from land clearing, and asphalt, concrete, bricks, and clean sand or gravel). So not all waste is counted.
On the other hand, “industry” doesn’t get any credit in this data for the tonnes of materials diverted by the country’s many beverage deposit-return systems, or for the used boxes and paper that are shipped direct from a retailer to a paper recycling mill rather than through a material recycling facility (MRF). Welcome to the challenge of analysing and interpreting data!
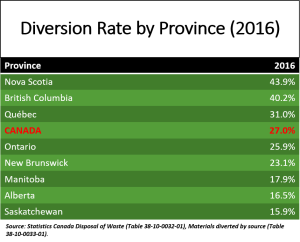
There is an interesting story to be found here though about diversion rates by province. The best performing provinces on a weight basis in 2016 were Nova Scotia and British Columbia. While Nova Scotia’s diversion rate has dipped slightly since 2008 it has consistently been in the 40% range, and in 2016 reached 44 per cent.

On the other coast, British Columbia, at 35% in 2008, jumped significantly between 2014 and 2016 to reach 40% for the first time, perhaps reflecting the impact of the launch of BC’s new industry-funded Blue Box program in 2014. Quebec ranks next at 31% followed by Ontario at 26% and New Brunswick at 23 per cent. They are followed by the laggards (Manitoba at 18%, Alberta at 17%, and Saskatchewan at 16%).
We’ll be having a look at the specific materials diverted and why some provinces are doing better than others in the next few blogs. Be prepared for some surprises. Nova Scotia might have the country’s highest diversion rate as a province, but Nova Scotians as individuals are not Canada’s best diverters! Stay tuned!
